 graphics
Tools
Programs, macros, and interfaces for analyzing and visualizing data
Webcharts
A charting library built on top of D3.js that offers a simple way to create reusable, flexible, interactive charts with JavaScript. Charts can be customized with a handful of settings and extended through callback functions. Webcharts can also create sets of controls that are tied to charts to dynamically manipulate chart data, appearance, or behavior.
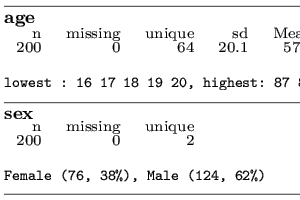
Codebook
This page shows how to generate something called a codebook. A codebook is a concise statistical description of each variable in a SAS dataset.
openFDA Adverse Event Explorer
This page lets users explore more than 3.5 million adverse event reports collected between 1/1/2004 and 1/1/2015 from the openFDA project.
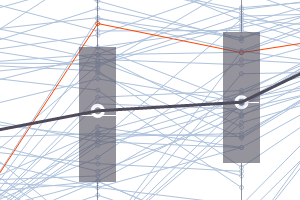
Lab Results Over Time with Interactive Normal Ranges
Linked charts showing participant lab results over time. The chart includes with interactive normal ranges and small multiples showing all lab measures for a participant of interest. This chart was created using webcharts, a charting library built using d3.js, being developed at Rho.
Immunologic Outcomes Explorer
This display is adapted from Figure 3 in Randomized Trial of Peanut Consumption in Infants at Risk for Peanut Allergy in response to reader correspondence in the New England Journal of Medicine. This interactive chart expands upon the static chart by allowing users to select from 5 outcomes and filter on participant for sex, ethnicity, study population, skin prick test stratum, and peanut specific IgE at 60 months.
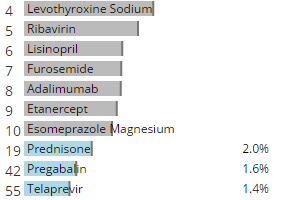
Adverse Event Explorer
This system provides interactive charts, tables, and listings for adverse events monitoring and analysis. Using responsive design elements (e.g., metadata, filterable results, nested displays, searchable fields), our AE Explorer streamlines the traditional AE monitoring process and allows researchers to interact with AE data in a dynamic manner.
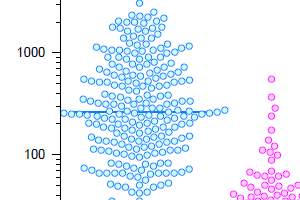
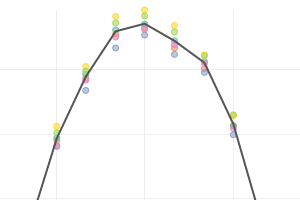
Beeswarm Plot
Static plot with jittering to reduce over-plotting in dense data sets
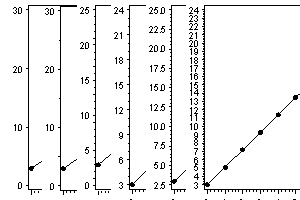
Axis Macro
SAS macro for setting optimal axis ranges
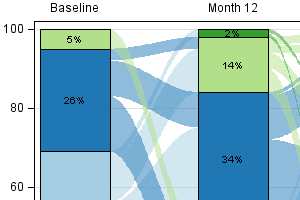
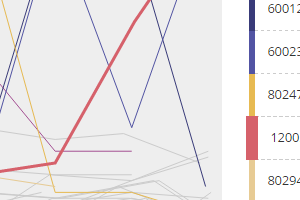
Sankey Bar Chart
Static or interactive plot for producing longitudinal bar charts with Sankey-style overlays