Overview
This example demonstrates how to achieve unbounded data points using the %AxisOrder macro.
We begin by introducing the output macro variables &_AxisListUnb, &_AxisMin, and &_AxisMax.
The list &_AxisListUnb is just &_AxisList with the first and last values trimmed off.
The use of VALUESHINT tells SGPLOT that the VALUES list is only for tick marks.
We use MIN and MAX to tell SGPLOT how far to extend the axis range (independent of the tick marks).
*---------- dummy data ----------;
data albumin;
do subject = 1 to 10;
do ady = -1, 7, 14, 28;
aval = 4.4 + rannor(1)/2 + ady/50;
anrlo = 3.4;
anrhi = 5.4;
output;
end;
end;
run;
*---------- call the macro ----------;
%AxisOrder
(Data=albumin
,Var=aval
);
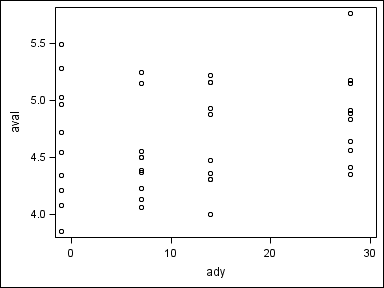
*---------- allow data points to be unbounded ----------;
proc sgplot data=albumin;
scatter x=ady y=aval;
yaxis values=(&_AxisListUnb) valueshint
min=&_AxisMin max=&_AxisMax;
run;
The next examples shows how to use the optional macro parameter Threshold.
This parameter can be though of as a combination of the YAXIS options THRESHOLDMIN and THRESHOLDMAX.
We use THRESHOLD=0.5, which means that bounding tick marks will be added if data points extend
at least half way to the next tick mark.
*---------- specifiy a threshold ----------;
%AxisOrder
   (Data=albumin
   ,Var=aval
   ,Threshold=0.5
   );

*---------- allow data points to be unbounded ----------;
proc sgplot data=albumin;
   scatter x=ady y=aval;
   yaxis values=(&_AxisListUnb) valueshint
         min=&_AxisMin max=&_AxisMax;
run;
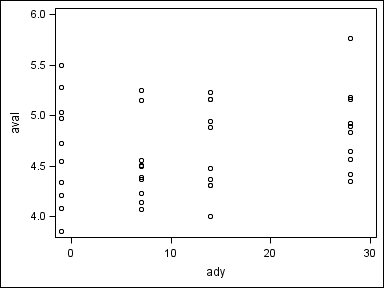
The largest data value extends more than half way to the next tick mark, so 6 is included as a tick mark. But on the low end, the lowest data value extends less than half way to the next tick mark, so 3.5 is not included as a tick mark.