Overview
The aesthetics of ODS Graphics are very different from those of SAS/GRAPH. One notable difference is that by default ODS Graphics do not require that all data points be bounded by tick marks.
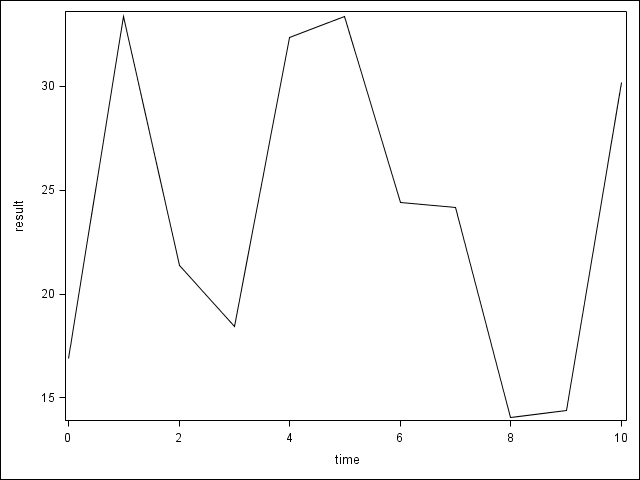
The simplest way to bound all data points with tick marks in ODS Graphics is to use the options THRESHOLDMIN and THRESHOLDMAX (9.3 and higher).
*--- using thresholds ---;
yaxis thresholdmin=1 thresholdmax=1;
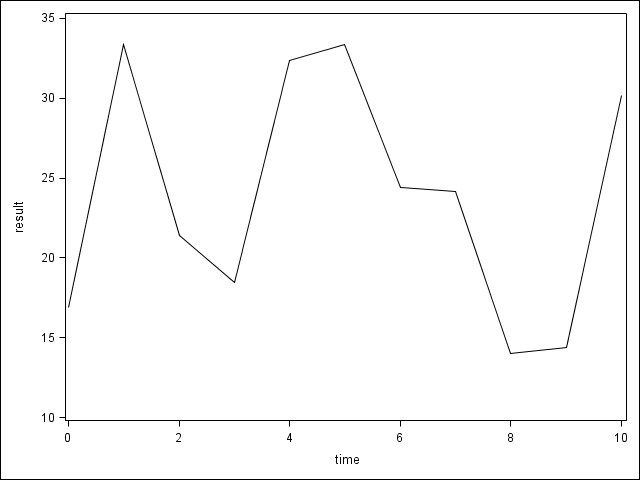
However, using this approach leaves SAS in charge of choosing how many tick marks are created. Unfortunately, SAS seems to be rather inflexible as it relates to the number of tick marks shown.
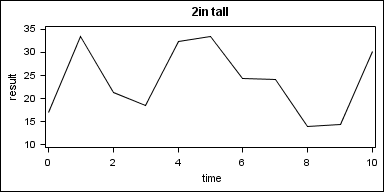
*--- 2in tall ---;
ods graphics / height=2in width=4in;
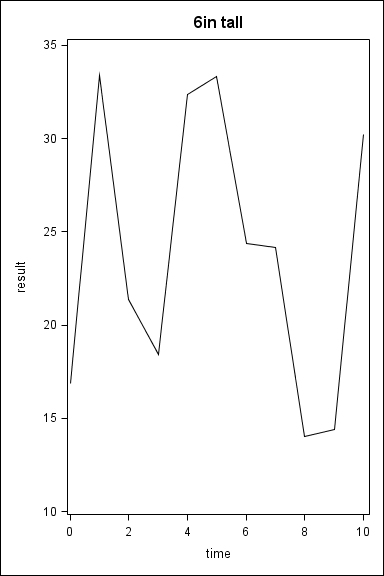
*--- 6in tall ---;
ods graphics / height=6in width=6in;
*--- 12in tall ---;
ods graphics / height=12in width=9in;
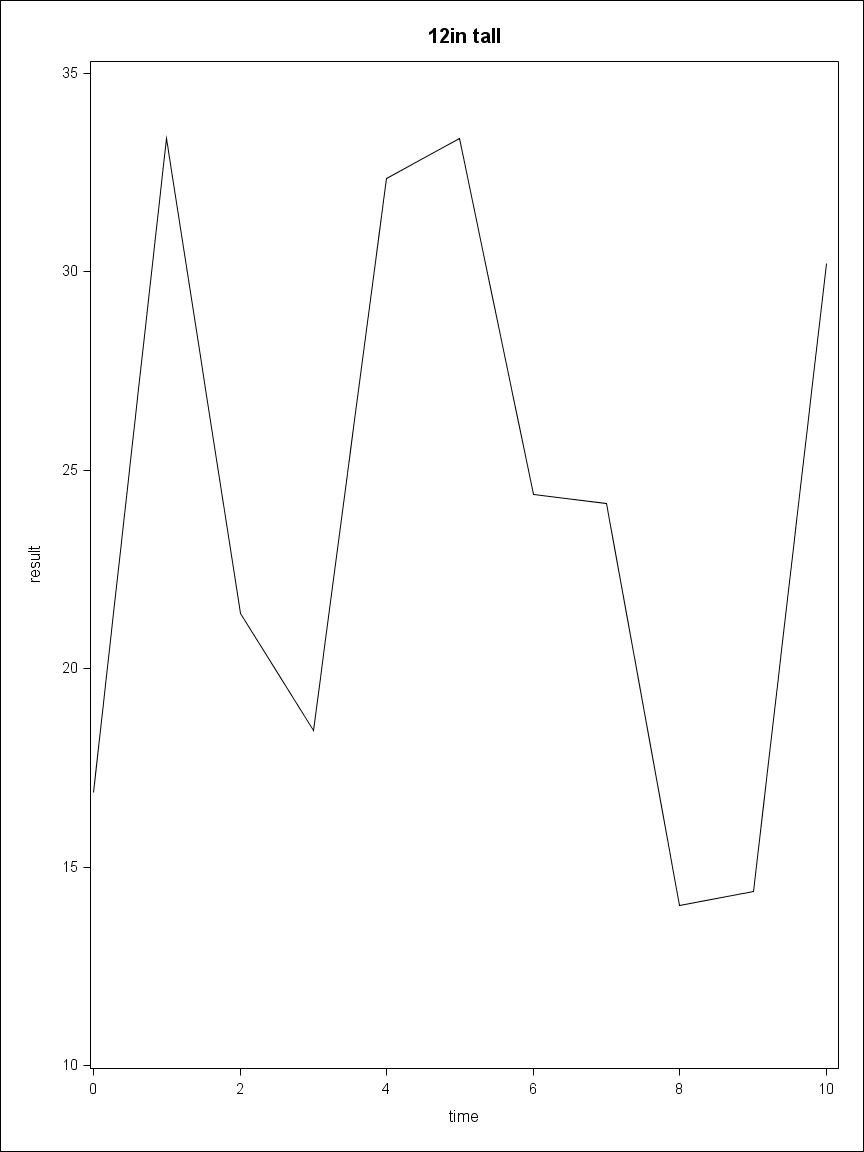
This insistence on the part of SAS that we use a certain number of tick marks is not appealing. Instead it makes more sense to use the %AxisOrder macro and specify a value of MajTarg that makes sense based on the height of your output.
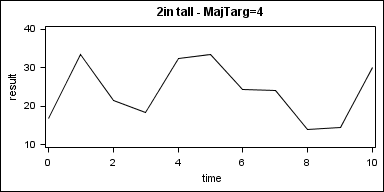
*--- 2in tall - MajTarg=4 ---;
ods graphics / height=2in width=4in;

%AxisOrder
   (Data=plotdata
   ,Var=result
   ,MajTarg=4
   );
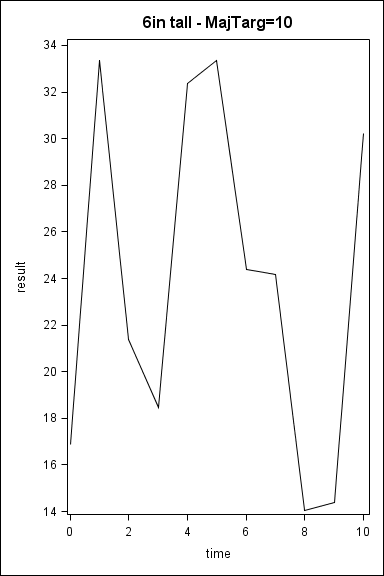
*--- 6in tall - MajTarg=10 ---;
ods graphics / height=6in width=6in;

%AxisOrder
   (Data=plotdata
   ,Var=result
   ,MajTarg=10
   );
*--- 12in tall - MajTarg=20 ---;
ods graphics / height=12in width=9in;

%AxisOrder
   (Data=plotdata
   ,Var=result
   ,MajTarg=20
   );
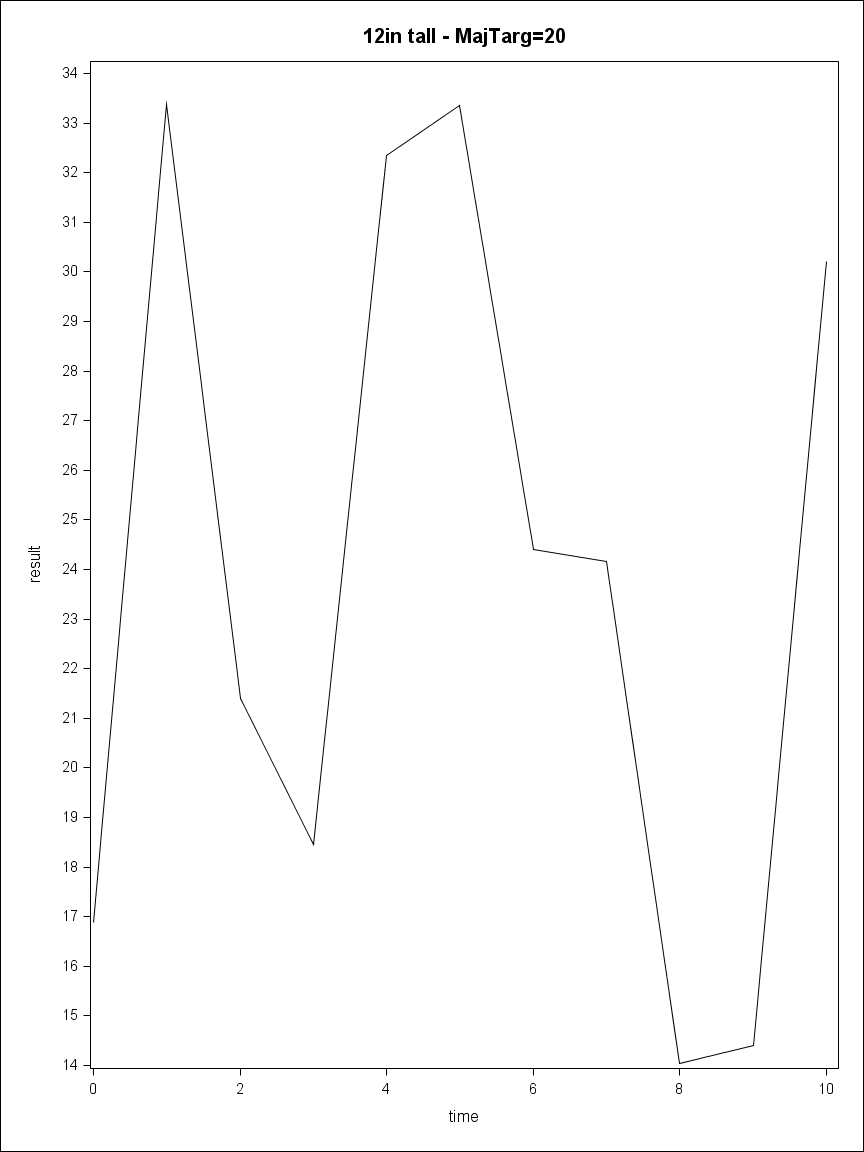
Thus endeth the digression.