Overview
This example demonstrates the basic functionality of the %AxisOrder macro (downloadable on the Macro page).
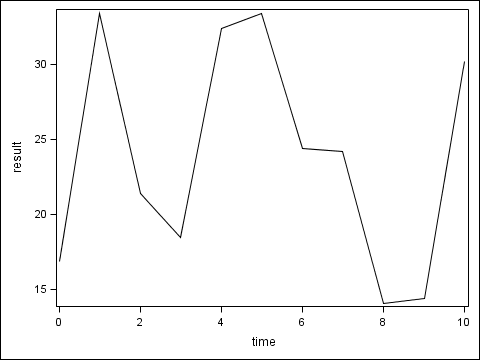
We begin with some dummy data and some default results from SGPLOT.
Notice that the procedure does not bound the data values with tick marks on the y-axis.
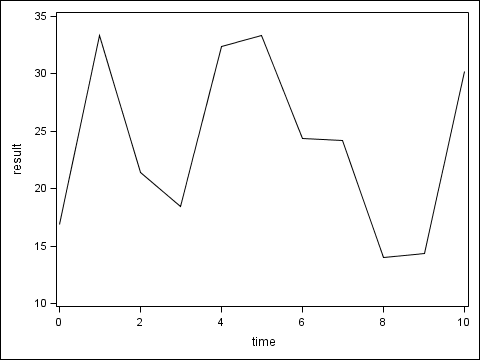
The %AxisOrder macro can be used to bound the data values with tick marks.
Source Code
SAS
*------------------------------------------------------------;
*---------- dummy data generation ----------;
*------------------------------------------------------------;

data plotdata;
   do time = 0 to 10;
      result = 21*ranuni(1) + 13;
      output;
   end;
run;


*------------------------------------------------------------;
*---------- default plot ----------;
*------------------------------------------------------------;

proc sgplot data=plotdata;
   series y=result x=time;
run;


*------------------------------------------------------------;
*---------- axis macro call ----------;
*------------------------------------------------------------;

%include "AxisOrder.sas";1

%AxisOrder
   (Data=plotdata
   ,Var=result
   );2


*------------------------------------------------------------;
*---------- customized plot ----------;
*------------------------------------------------------------;

proc sgplot data=plotdata;
   series y=result x=time;
   yaxis values=(&_AxisStart to &_AxisEnd by &_AxisBy);3
run;
1 See menu for macro download links.
2 The user specifies the dataset and variable on which the axis range is to be based.
3 %AxisOrder produces a set of macro variables _AxisStart, _AxisEnd, and _AxisBy.
The programmer then uses these macro variables in their YAXIS statement.
Data
The above code generates raw data with random number functions. No data download is necessary.