Overview
This example moves slightly beyond the basic functionality of the %AxisOrder macro (downloadable on the Macro page).
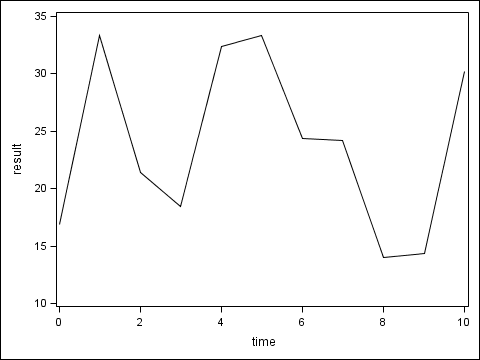
The default for the macro is to try to give start, end, and by values that will result in 6 tick marks.
*--- default macro application ---;
%AxisOrder
(Data=plotdata
,Var=result
);
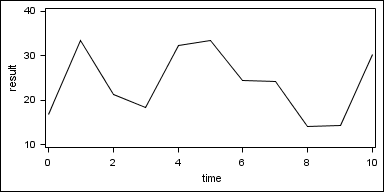
The macro has an optional parameter that lets you specify a different number of tick marks.
For instance, if you have a very small figure you might only want 4 tick marks.
*--- ask for 4 tick marks ---;
%AxisOrder
(Data=plotdata
,Var=result
,MajTarg=4
);
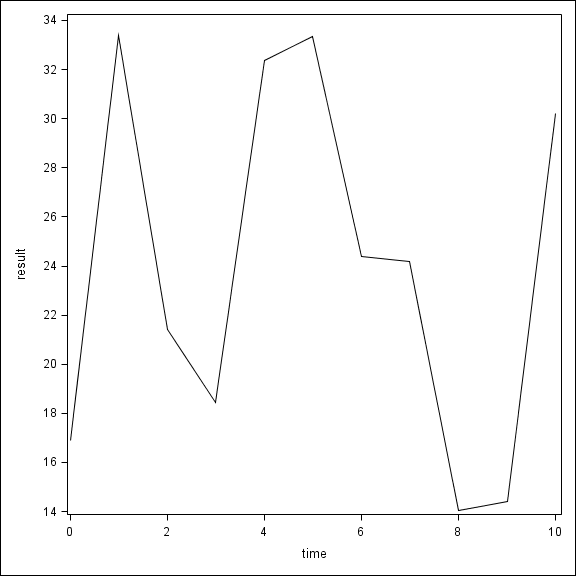
On the other hand, very large figures might have room for many more tick marks.
*--- ask for 12 tick marks ---;
%AxisOrder
(Data=plotdata
,Var=result
,MajTarg=12
);
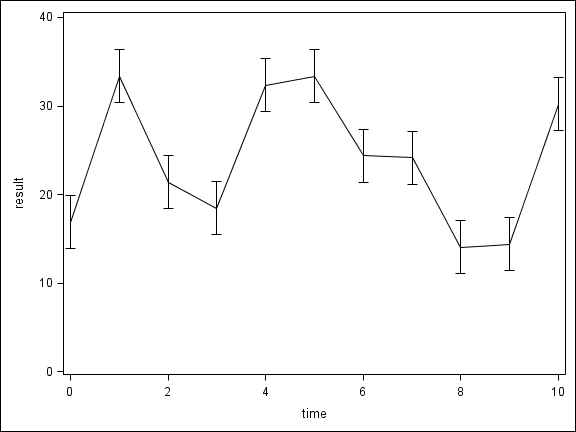
The macro is able to fit an axis range using more than one variable.
E.g., if you are including error bars in your plot.
The macro is also able to incorporate hardcoded values into the axis range.
E.g., if you want to make sure zero is included in your axis range.
*--- multiple variables (Var=) and zero (Val=) ---;
%AxisOrder
(Data=plotdata
,Var=result errorupper errorlower
,Val=0
);
Source Code
Source Code
SAS
*---------------------------------------------------------------;
*---------- include macro ----------;
*---------------------------------------------------------------;

%include "AxisOrder_v5.sas";1


*---------------------------------------------------------------;
*---------- dummy data generation ----------;
*---------------------------------------------------------------;

data plotdata;
   do time = 0 to 10;
      result = 21*ranuni(1) + 13;
      errorupper = result + 3;
      errorlower = result - 3;
      output;
   end;
run;


*---------------------------------------------------------------;
*---------- default macro application ----------;
*---------------------------------------------------------------;

ods graphics / width=480px;

%AxisOrder
   (Data=plotdata
   ,Var=result
   );

proc sgplot data=plotdata;
   series y=result x=time;
   yaxis values=(&_AxisStart to &_AxisEnd by &_AxisBy);
run;


*---------------------------------------------------------------;
*---------- ask for 4 tick marks ----------;
*---------------------------------------------------------------;

ods graphics / height=2in width=4in;2

%AxisOrder
   (Data=plotdata
   ,Var=result
   ,MajTarg=4
   );

proc sgplot data=plotdata noautolegend;
   series y=result x=time;
   yaxis values=(&_AxisStart to &_AxisEnd by &_AxisBy);
run;


*---------------------------------------------------------------;
*---------- ask for 12 tick marks ----------;
*---------------------------------------------------------------;

ods graphics / height=6in width=6in;3

%AxisOrder
   (Data=plotdata
   ,Var=result
   ,MajTarg=12
   );

proc sgplot data=plotdata noautolegend;
   series y=result x=time;
   yaxis values=(&_AxisStart to &_AxisEnd by &_AxisBy);
run;


*---------------------------------------------------------------;
*---------- multiple variables (Var=) and zero (Val=) ----------;
*---------------------------------------------------------------;

ods graphics / reset=height;

%AxisOrder
   (Data=plotdata
   ,Var=result errorlower errorupper
   ,Val=0
   );4

proc sgplot data=plotdata noautolegend;
   series y=result x=time;
   scatter y=result x=time /
      markerattrs=(size=0)
      yerrorupper=errorupper
      yerrorlower=errorlower
      ;
   yaxis values=(&_AxisStart to &_AxisEnd by &_AxisBy);
run;
1 See menu for macro download links.
2 Shorter graphs have room for fewer tick marks.
3 Taller graphs have room for more tick marks.
4 Multiple variables may be specified (Var=), as well as individual values (Val=).
Data
The above code generates raw data with random number functions. No data download is necessary.